In part 1 of this series I showed how to use Power Query to extract Extended Event data generated by SSAS. Having done that, I now want to show the first (I hope of many) examples of how this data can be used for performance tuning: analysing activity in the Storage Engine, the part of SSAS that reads data from disk and aggregates it up.
I won’t go into the technical details of how I’ve used Power Query to crunch this data; you can download the sample workbook here and see for yourself. There’s nothing particularly complex going on. In brief, what I’ve done is the following:
- Called the function shown in part 1 to get the raw Extended Event data
- Filtered that data so that only the Query End, Query Subcube Verbose and Progress Report End events are left
- Calculated the start time of each event relative to the start time of the earliest recorded event, to make plotting these events on a waterfall chart possible
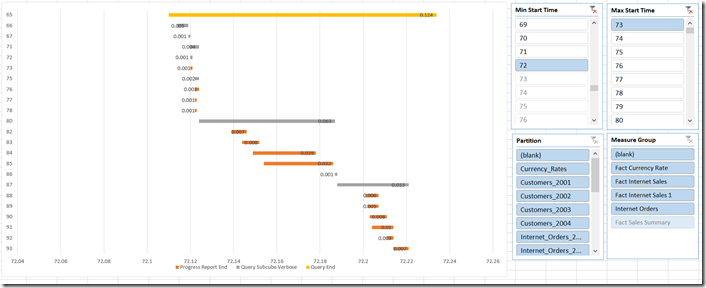
- Built an Excel report, including various Power Pivot measures, some normal slicers to make it easy to filter the data, some disconnected slicers for filtering so you only see events that started within a given time range, and a PivotChart showing the waterfall chart (since Excel doesn’t support this type of chart natively, I’ve used this technique to reproduce a waterfall chart with a stacked bar chart)
Here’s an example screenshot of the result, showing Storage Engine activity for a single query:
Though it’s hard to see the details at this resolution, the yellow line is the Query End event associated with the query, the grey lines are the Query Subcube Verbose events associated with the query, and the brown lines are the Progress Report events associated with each Query Subcube Verbose event.
What could this be used for? Here are some ideas:
- Looking for times when there are a lot of queries running simultaneously – and which, as a result, may be performing poorly.
- Looking for long-running Query Subcube Verbose and Progress Report End events which could be optimised by the creation of aggregations.
- Visualising the amount of parallelism inside the Storage Engine, in particular the number of Progress Report End events that are running in parallel. This would be very interesting for queries using distinct count measures when you are testing different ways of partitioning your measure group.
- Highlighting situations where calculations are being evaluated in cell-by-cell mode. When this happens you typically see a very large number of Query Subcube Verbose events being fired off within a query.
I’d like to stress once again that the object of this exercise is not to show off a ‘finished’ tool, but to show how Power Query, Power Pivot and Excel can be used for self-service analysis of this data. This workbook is just a starting point: if you wanted to use this on your own data it’s extremely likely you’d need to change the Power Query queries, the Power Pivot model and the report itself. Hopefully, though, this workbook will save you a lot of time if you do need to understand what’s going on in the Storage Engine when you run an MDX query.
